Here are comments on Xavier Gabaix' "A Behavioral new-Keynesian model." Xavier presented at the October 21 NBER Economic Fluctuations and growth meeting, and I was the discussant. Slides here
Short summary: It's a really important paper. I think it's too important to be true.
Gabaix' irrationality fixes the pathologies of the standard model by making a stable model unstable, and hence locally determinate. Gabaix' irrationality parameter M in [0,1] can thus substitute for the usual Taylor principle that interest rates move more than one for one with inflation.
Gabaix imagines -- after three papers worth of careful math -- that people pay less attention to future income when deciding on consumption than they should. Making today's consumption less sensitive to future income, means expectations of future income are larger for any amount of today's consumption. Thus, it makes model dynamics unstable.
But just a little irrationality won't do. If you move a stable eigenvalue, say 0.8, by a bit, say 0.85, it's still stable. You have to move it all the way past 1 before it does any good at all.
Thus, Gabaix puts irrationality right in the middle of monetary policy. If Gabaix is right, you simply cannot explain monetary policy in simple terms with money supply and money demand, or interest rate rises lower investment and inflation via a Phillips curve, as simple approximations that more complex models, perhaps involving some irrationality, improve on. Monetary policy is centrally about the Fed exploiting irrationality, full stop, and cannot be explained or understood at all without that feature.
More in the comments. There are too many equations and figures to mirror it here, so you have to get the pdf if you're interested. This is for academics anyway.
Tampilkan postingan dengan label Interesting Papers. Tampilkan semua postingan
Tampilkan postingan dengan label Interesting Papers. Tampilkan semua postingan
Senin, 24 Oktober 2016

Kamis, 28 Juli 2016
Macro-Finance
A new essay "Macro-Finance," based on a talk I gave at the University of Melbourne this Spring. I survey many current frameworks including habits, long run risks, idiosyncratic risks, heterogenous preferences, rare disasters, probability mistakes, and debt or institutional finance. I show how all these approaches produce quite similar results and mechanisms: the market's ability to bear risk varies over time, with business cycles. I speculate with some simple models that time-varying risk premiums can produce a theory of risk-averse recessions, produced by varying risk aversion and precautionary saving, rather than Keynesian flow constraints or new-Keynesian intertemporal substitution.
Rabu, 06 Juli 2016
NYT on zoning
Conor Dougherty in The New York Times has a good article on zoning laws,
No. The Times, the Obama Administration, California Governor Gerry Brown, have figured out that zoning laws are to blame, and they're making social stratification and inequality worse.
The article focuses on Boulder Colorado, where
a growing body of economic literature suggests that anti-growth sentiment... is a major factor in creating a stagnant and less equal American economy.
...Unlike past decades, when people of different socioeconomic backgrounds tended to move to similar areas, today, less-skilled workers often go where jobs are scarcer but housing is cheap, instead of heading to places with the most promising job opportunities according to research by Daniel Shoag, a professor of public policy at Harvard, and Peter Ganong, also of Harvard.
One reason they’re not migrating to places with better job prospects is that rich cities like San Francisco and Seattle have gotten so expensive that working-class people cannot afford to move there. Even if they could, there would not be much point, since whatever they gained in pay would be swallowed up by rent.Stop and rejoice. This is, after all, the New York Times, not the Cato Review. One might expect high housing prices to get blamed on developers, greed, or something, and the solution to be government-constructed housing, "affordable" housing mandates, rent controls, low-income housing subsidies (which protect incumbent low-income people, not those who want to move in to get better jobs) and even more restrictions.
No. The Times, the Obama Administration, California Governor Gerry Brown, have figured out that zoning laws are to blame, and they're making social stratification and inequality worse.
In response, a group of politicians, including Gov. Jerry Brown of California and President Obama, are joining with developers in trying to get cities to streamline many of the local zoning laws that, they say, make homes more expensive and hold too many newcomers at bay.
.. laws aimed at things like “maintaining neighborhood character” or limiting how many unrelated people can live together in the same house contribute to racial segregation and deeper class disparities. They also exacerbate inequality by restricting the housing supply in places where demand is greatest.
“You don’t want rules made entirely for people that have something, at the expense of people who don’t,” said Jason Furman, chairman of the White House Council of Economic Advisers.This could be a lovely moment in which a bipartisan consensus can get together and fix a real problem.
The article focuses on Boulder Colorado, where
.. the university churns out smart people, the smart people attract employers, and the amenities make everyone want to stay. Twitter is expanding its offices downtown. A few miles away, a big hole full of construction equipment marks a new Google campus that will allow the company to expand its Boulder work force to 1,500 from 400.Actually, The reason Google and Twitter are in Boulder is that things are much, much worse in Palo Alto! A fate Boulder may soon share:
“We don’t need one more job in Boulder,” Mr. Pomerance said. “We don’t need to grow anymore. Go somewhere else where they need you.”
Jumat, 17 Juni 2016
Syverson on the productivity slowdown
Chad Syverson has an interesting new paper on the sources of the productivity slowdown.
Background to wake you up: Long-term US growth is slowing down. This is a (the!) big important issue in economics (one previous post). And productivity -- how much each person can produce per hour -- is the only source of long-term growth. We are not vastly better off than our grandparents because we negotiated better wages for hacking at coal with pickaxes.
Why is productivity slowing down? Perhaps we've run out of ideas (Gordon). Perhaps a savings glut and the zero bound drive secular stagnation lack of demand (Summers). Perhaps the out of control regulatory leviathan is killing growth with a thousand cuts (Cochrane).
Or maybe productivity isn't declining at all, we're just measuring new products badly (Varian; Silicon Valley). Google maps is free! If so, we are living with undiagnosed but healthy deflation, and real GDP growth is actually doing well.
Chad:
Background to wake you up: Long-term US growth is slowing down. This is a (the!) big important issue in economics (one previous post). And productivity -- how much each person can produce per hour -- is the only source of long-term growth. We are not vastly better off than our grandparents because we negotiated better wages for hacking at coal with pickaxes.
Why is productivity slowing down? Perhaps we've run out of ideas (Gordon). Perhaps a savings glut and the zero bound drive secular stagnation lack of demand (Summers). Perhaps the out of control regulatory leviathan is killing growth with a thousand cuts (Cochrane).
Or maybe productivity isn't declining at all, we're just measuring new products badly (Varian; Silicon Valley). Google maps is free! If so, we are living with undiagnosed but healthy deflation, and real GDP growth is actually doing well.
Chad:
First, the productivity slowdown has occurred in dozens of countries, and its size is unrelated to measures of the countries’ consumption or production intensities of information and communication technologies ... Second, estimates... of the surplus created by internet-linked digital technologies fall far short of the $2.7 trillion or more of “missing output” resulting from the productivity growth slowdown...Third, if measurement problems were to account for even a modest share of this missing output, the properly measured output and productivity growth rates of industries that produce and service ICTs [internet] would have to have been multiples of their measured growth in the data. Fourth, while measured gross domestic income has been on average higher than measured gross domestic product since 2004—perhaps indicating workers are being paid to make products that are given away for free or at highly discounted prices—this trend actually began before the productivity slowdown and moreover reflects unusually high capital income rather than labor income (i.e., profits are unusually high). In combination, these complementary facets of evidence suggest that the reasonable prima facie case for the mismeasurement hypothesis faces real hurdles when confronted with the data.
An interesting read throughout.
[Except for that last sentence, a near parody of academic caution!]
Rabu, 08 Juni 2016
How to raise GDP 10%, and reduce inequality too
Chang-Tai Hsieh and Enrico Moretti have a very nice new working paper "Why do Cities Matter?"
The right tail there isn't just missing -- it was absent in 1964. There weren't any cities (MSA's) with 50% higher wages than average in 1964. That's New York, San Francisco and San Jose now.
What does this have to do with growth?
Suppose there are good opportunities, for high productivity employment in an area like Silicon Valley. Businesses start, try to expand, and bid up wages to match the higher productivity. That's all good, but with strong housing restrictions it stops there. New people can't move in to take those high wage jobs. They try to, but they bid up house prices until the higher house price matches the higher wage.
Now suppose there are fewer restrictions on building new houses or more dense houses. Then lots of new workers can move in, the businesses an expand. Eventually, a much larger group of workers gets the higher wages, and the business expands a lot.
So, productivity-enhancing ideas mixed with housing restrictions don't do nearly as much for growth as those ideas with more open housing markets -- especially markets open to newcomers. Housing restrictions also hurt measured inequality, by creating this large wage gap. (Inequality measures typically do not control for local housing costs. Rent controls and "affordable housing" lotteries may seem to help low income people, but only those who have been there for a while, not workers moving in for new and better jobs.)
The paper has a clear model and careful calculation of this effect. Their bottom line is that US GDP would be overall about 10% higher than it is now -- and not just in some free-market nirvana, just if New York, San Francisco and San Jose were "only" as restrictive as the typical US city.
This fits in to the long simmering issue of how much micro-economic distortions and rent-seeking are hindering long run growth. My view, here for example, holds that micro economic regulation is holding back growth a lot. The contrary view is that regulation is a small-potato annoyance, 1-2% growth is as good as it gets, go back to slicing up the smaller pie. The trouble is that for all the regulation horror stories, it's hard to put together solid numbers.
Here is one. 10%. Just from zoning laws and other building restrictions.
..increased wage dispersion lowered aggregate U.S. GDP by 13.5% Most of the loss was likely caused by increased constraints to housing supply in high productivity cities like New York, San Francisco and San Jose. Lowering regulatory constraints in these cities to the level of the median city would expand their work force and increase U.S. GDP by 9.5%.Roughly, the same worker, working the same job, in San Jose or San Francisco, earns double what he or she earns somewhere else in the country. Here is their plot of wages across cities:
 |
| Sure: Chang-Tai Hsieh and Enrico Moretti |
The right tail there isn't just missing -- it was absent in 1964. There weren't any cities (MSA's) with 50% higher wages than average in 1964. That's New York, San Francisco and San Jose now.
What does this have to do with growth?
Suppose there are good opportunities, for high productivity employment in an area like Silicon Valley. Businesses start, try to expand, and bid up wages to match the higher productivity. That's all good, but with strong housing restrictions it stops there. New people can't move in to take those high wage jobs. They try to, but they bid up house prices until the higher house price matches the higher wage.
Now suppose there are fewer restrictions on building new houses or more dense houses. Then lots of new workers can move in, the businesses an expand. Eventually, a much larger group of workers gets the higher wages, and the business expands a lot.
So, productivity-enhancing ideas mixed with housing restrictions don't do nearly as much for growth as those ideas with more open housing markets -- especially markets open to newcomers. Housing restrictions also hurt measured inequality, by creating this large wage gap. (Inequality measures typically do not control for local housing costs. Rent controls and "affordable housing" lotteries may seem to help low income people, but only those who have been there for a while, not workers moving in for new and better jobs.)
The paper has a clear model and careful calculation of this effect. Their bottom line is that US GDP would be overall about 10% higher than it is now -- and not just in some free-market nirvana, just if New York, San Francisco and San Jose were "only" as restrictive as the typical US city.
This fits in to the long simmering issue of how much micro-economic distortions and rent-seeking are hindering long run growth. My view, here for example, holds that micro economic regulation is holding back growth a lot. The contrary view is that regulation is a small-potato annoyance, 1-2% growth is as good as it gets, go back to slicing up the smaller pie. The trouble is that for all the regulation horror stories, it's hard to put together solid numbers.
Here is one. 10%. Just from zoning laws and other building restrictions.
Rabu, 04 Mei 2016
Central Bank Governance and Oversight Reform
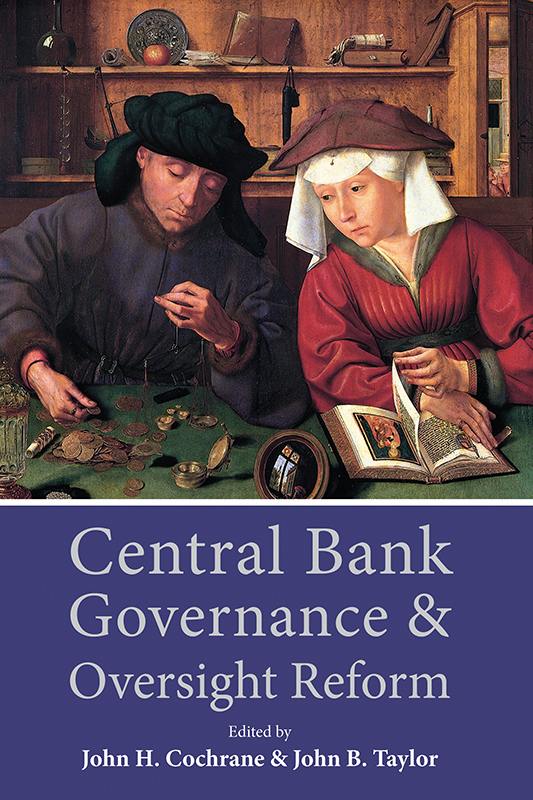
(My modest contributions are in the preface and a discussion of Paul Tucker's Chapter 1. I agree it would be nice to have a more rule-based approach to lender of last resort and bailout functions, but wouldn't lots of equity so you don't have to mop up so often be even better?)
This is part of an emerging series of monetary policy conferences at Hoover. Tomorrow we will have a conference on international monetary policy. Stay tuned...
The blurb:
How can we balance the central bank’s authority, including independence, with accountability and constraints? Drawn from a 2015 Hoover Institution conference, this book features distinguished scholars and policy makers’ discussing this and other key questions about the Fed. Going beyond the simple decision of whether to raise interest rates, they focus on a deeper set of questions, including, among others, How should the Fed make decisions? How should the Fed govern its internal decision-making processes? What is the trade-off between greater Fed power and less Fed independence? And how should Congress, from which the Fed ultimately receives its authority, oversee the Fed?The contents:
The contributors discuss, for instance, whether central banks can both follow rule-based policy in normal times but then take a discretionary, do-what-it-takes approach to stopping financial crises. They evaluate legislation, recently proposed in the U.S. House and Senate, that would require the Fed to describe its monetary policy rule and, if and when the Fed changed or deviated from its rule, explain the reasons. And they discuss to best ways to structure a committee—like the Federal Open Market Committee, which sets interest rates—to make good decisions, as well as offer historical reflections on the governance of the Fed and much more. They conclude with an important reminder: how important it is to have a “healthy separation between government officials who are in charge of spending and those who are in charge of printing money,” the most essential part of good governance.
Preface
By John H. Cochrane and John B. Taylor
Chapter 1: How Can Central Banks Deliver Credible Commitment and Be “Emergency Institutions”?
By Paul Tucker
Chapter 2: Policy Rule Legislation in Practice
By David H. Papell, Alex Nikolsko-Rzhevskyy and Ruxandra Prodan
Chapter 3: Goals versus Rules as Central Bank Performance Measures
By Carl E. Walsh
Chapter 4: Institutional Design: Deliberations, Decisions, and Committee Dynamics
By Kevin M. Warsh
Chapter 5: Some Historical Reflections on the Governance of the Federal Reserve
By Michael D. Bordo
Chapter 6: Panel on Independence, Accountability, and Transparency in Central Bank Governance
By Charles I. Plosser, George P. Shultz, and John C. Williams
Minggu, 10 April 2016
NBER AP
On Friday I attended the NBER Asset Pricing meeting (program here) in Chicago, organized by Adrien Verdelhan and Debby Lucas. The papers were unusually interesting, even by the high standards of this meeting. Alas the NBER doesn't post slides so I don't have great visuals to show you.
Lars Hansen started with the latest in the Hansen-Sargent ambiguity / robustness work,Sets of Models and Prices of Uncertainty. Stavros Panageas gave a beautiful discussion, complete with power point animations. He characterized the paper as a major advance, for reducing the range of models over which an ambiguous agent looks for the worst case scenario, and for making that range state-dependent.
In the application, the agent worries that the mean growth rate of consumption and the AR(1) coefficient might be wrong; a more persistent consumption growth process is hurtful, and that pain is more in bad times.
I haven't followed this work closely enough. I still wonder what the testable implcations are -- how different is the asset pricing model from one in which the true consumption growth process is just a bit different from our estimate, in the worst possible way?
Still, it's nice to see a Nobel Prize winner leading off a conference, and with easily the most technical paper at that conference, with another one (Rob Engle) in the audience. That tells you something about the seriousness of this group. Also, this is serious behavioral finance by any metric -- a disciplined model of probability misperceptions, which is nice to see.
Robert Novy-Marx presented Testing Strategies Based on Multiple Signals, discussed by Moto Yogo. We're all familiar with the phenomenon that if you try 10 characteristics and pick the best few to forecast returns, t statistics are biased and performance falls out of sample.
Robert pointed out that if you put those best 3 in a portfolio, they diversify each other, reducing the in-sample variance of the portfolio, and boosting Sharpe ratios and t-statistics even further.
Many ``smart beta'' funds are doing this, so the fall-off in performance from backtest to real money is relevant beyond academia.
The extent of this bias is impressive. Here is the distribution of t statistics that results when you pick the best three of 20 completely useless signals, and put them in a portfolio. Critical values of 4 and 5 show up routinely in Robert's calculations.

Laura Veldkamp presented her work with Nina Boyarchenko, David Lucca, and Laura Veldkamp, Taking Orders and Taking Notes: Dealer Information Sharing in Financial Markets. Discussed ably (of course) by Darrell Duffie. Is it a problem that the dealers who are the prime bidders at treasury auctions have been caught talking to each other ahead of the auction? Surprisingly, no: The Treasury can come out ahead when dealers share information with each other, and investors can potentially come out ahead too.
This warms my contrarian economist heart. We know so little about how markets work, and regulators are so quick to jump on supposedly bad behavor, it's lovely to see a clear and convincing model, that explains the kind of second-order and equilibrium effects that economists are good at.
Brian Weller presented Measuring Tail Risks at High Frequency, discussed nicely by Mike Chernov. Brian's basic idea is to run cross-sectional regressions of bid/ask spreads, normalized by volume and depth, on the cross-section of factor betas. Since spreads are larger when dealers are more worried about big jumps, this produces a measure of time-varying probability x size of such jumps. The measure correlates well with the VIX.
Michael Bauer presented his paper with Jim Hamilton Robust Bond Risk Premia discussed very nicely by Greg Duffee. (My discussion of a previous presentation). This paper is really about whether macro variables help to forecast bond returns. We're used to "Stambaugh bias:'' if you forecast returns with a persistent regressor, and the innovation in the regressor is strongly negatively correlated with the innovation in the return, then the near-unit-root downward bias in the regressor autocorrelation seeps over into upward bias of return predictability. But macro variables forecasting bond returns have innovations nearly uncorrelated with the returns, so that's not much of a problem. Michael and Jim show another problem: with overlappping returns, t statistics can be biased down too.
This led to a pleasant reassessment of bond return forecasts. Some points that came up: econometrics aside, many return forecasters don't do well out of sample. Many of the issues are specification issues orthogonal to this econometric point. For example, evaluating the huge forecastability of bond returns from a combination of level and inflation documented by Anna Cieslak and Pavol Povala, where the forecasters look a lot like a trend, is really about specification and interpretation, not econometrics. I held out the view that the important part of my paper with Monika Piazzesi is the single-factor structure of expected returns, not whether small principal components help to forecast returns. We had a pleasant interchange on whether it's a good or terrible idea to run one-year horizon forecasting regressions. I like them, because they attenuate measurement error. Raising a weekly autoregression to the 52nd power yields junk. Greg likes them, and gave a stirring reminder of Bob Hodrick's point that you can include lags of the forecasting variables instead.
Nick Roussanov presented his paper with Erik Gilje and Robert Ready, Fracking, Drilling, and Asset Pricing: Estimating the Economic Benefits of the Shale Revolution with Wei Xiong discussing. They track the reaction of stock prices to the shale oil boom. In particular, they showed that stocks which rose on a huge shale announcement subsequently rose even more as more good shale news came in. Until, as Wei pointed out, prices collapsed.
Nick also used stock market value to try to get at an estimate of the economics benefits of fracking. It's a worthy effort, but let's remember the difficulties. In a competitive no-adjustment cost world, profits are zero and there are no abnormal stock returns. Stock capitalization may rise, as firms issue stock to invest. But that measures the value of capital invested, not the consumer surplus of shale. Still, the general idea of mixing asset pricing, energy economics, and making economic measurements from stock prices is intriguing.
Jonathan Sokobin, Chief Economist, FINRA presented "An Overview of FINRA Data" which I alas had to miss. I'm delighted anyone from the government wants us to use their data!
The AP meeting has a nice tradition. Usually the most boring part of a conference is the author's response to discussant. The AP meetings do away with this -- or rather, the author can respond if someone in the audience raises his or her hand and says "I'd like to hear your response to x." That actually happened! But by and large the AP meetings preserve time and a tradition of very active participation and discussion, and this one was no different.
Lars Hansen started with the latest in the Hansen-Sargent ambiguity / robustness work,Sets of Models and Prices of Uncertainty. Stavros Panageas gave a beautiful discussion, complete with power point animations. He characterized the paper as a major advance, for reducing the range of models over which an ambiguous agent looks for the worst case scenario, and for making that range state-dependent.
In the application, the agent worries that the mean growth rate of consumption and the AR(1) coefficient might be wrong; a more persistent consumption growth process is hurtful, and that pain is more in bad times.
I haven't followed this work closely enough. I still wonder what the testable implcations are -- how different is the asset pricing model from one in which the true consumption growth process is just a bit different from our estimate, in the worst possible way?
Still, it's nice to see a Nobel Prize winner leading off a conference, and with easily the most technical paper at that conference, with another one (Rob Engle) in the audience. That tells you something about the seriousness of this group. Also, this is serious behavioral finance by any metric -- a disciplined model of probability misperceptions, which is nice to see.
Robert Novy-Marx presented Testing Strategies Based on Multiple Signals, discussed by Moto Yogo. We're all familiar with the phenomenon that if you try 10 characteristics and pick the best few to forecast returns, t statistics are biased and performance falls out of sample.
Robert pointed out that if you put those best 3 in a portfolio, they diversify each other, reducing the in-sample variance of the portfolio, and boosting Sharpe ratios and t-statistics even further.
Many ``smart beta'' funds are doing this, so the fall-off in performance from backtest to real money is relevant beyond academia.
The extent of this bias is impressive. Here is the distribution of t statistics that results when you pick the best three of 20 completely useless signals, and put them in a portfolio. Critical values of 4 and 5 show up routinely in Robert's calculations.

Laura Veldkamp presented her work with Nina Boyarchenko, David Lucca, and Laura Veldkamp, Taking Orders and Taking Notes: Dealer Information Sharing in Financial Markets. Discussed ably (of course) by Darrell Duffie. Is it a problem that the dealers who are the prime bidders at treasury auctions have been caught talking to each other ahead of the auction? Surprisingly, no: The Treasury can come out ahead when dealers share information with each other, and investors can potentially come out ahead too.
This warms my contrarian economist heart. We know so little about how markets work, and regulators are so quick to jump on supposedly bad behavor, it's lovely to see a clear and convincing model, that explains the kind of second-order and equilibrium effects that economists are good at.
Brian Weller presented Measuring Tail Risks at High Frequency, discussed nicely by Mike Chernov. Brian's basic idea is to run cross-sectional regressions of bid/ask spreads, normalized by volume and depth, on the cross-section of factor betas. Since spreads are larger when dealers are more worried about big jumps, this produces a measure of time-varying probability x size of such jumps. The measure correlates well with the VIX.
Michael Bauer presented his paper with Jim Hamilton Robust Bond Risk Premia discussed very nicely by Greg Duffee. (My discussion of a previous presentation). This paper is really about whether macro variables help to forecast bond returns. We're used to "Stambaugh bias:'' if you forecast returns with a persistent regressor, and the innovation in the regressor is strongly negatively correlated with the innovation in the return, then the near-unit-root downward bias in the regressor autocorrelation seeps over into upward bias of return predictability. But macro variables forecasting bond returns have innovations nearly uncorrelated with the returns, so that's not much of a problem. Michael and Jim show another problem: with overlappping returns, t statistics can be biased down too.
This led to a pleasant reassessment of bond return forecasts. Some points that came up: econometrics aside, many return forecasters don't do well out of sample. Many of the issues are specification issues orthogonal to this econometric point. For example, evaluating the huge forecastability of bond returns from a combination of level and inflation documented by Anna Cieslak and Pavol Povala, where the forecasters look a lot like a trend, is really about specification and interpretation, not econometrics. I held out the view that the important part of my paper with Monika Piazzesi is the single-factor structure of expected returns, not whether small principal components help to forecast returns. We had a pleasant interchange on whether it's a good or terrible idea to run one-year horizon forecasting regressions. I like them, because they attenuate measurement error. Raising a weekly autoregression to the 52nd power yields junk. Greg likes them, and gave a stirring reminder of Bob Hodrick's point that you can include lags of the forecasting variables instead.
Nick Roussanov presented his paper with Erik Gilje and Robert Ready, Fracking, Drilling, and Asset Pricing: Estimating the Economic Benefits of the Shale Revolution with Wei Xiong discussing. They track the reaction of stock prices to the shale oil boom. In particular, they showed that stocks which rose on a huge shale announcement subsequently rose even more as more good shale news came in. Until, as Wei pointed out, prices collapsed.
Nick also used stock market value to try to get at an estimate of the economics benefits of fracking. It's a worthy effort, but let's remember the difficulties. In a competitive no-adjustment cost world, profits are zero and there are no abnormal stock returns. Stock capitalization may rise, as firms issue stock to invest. But that measures the value of capital invested, not the consumer surplus of shale. Still, the general idea of mixing asset pricing, energy economics, and making economic measurements from stock prices is intriguing.
Jonathan Sokobin, Chief Economist, FINRA presented "An Overview of FINRA Data" which I alas had to miss. I'm delighted anyone from the government wants us to use their data!
The AP meeting has a nice tradition. Usually the most boring part of a conference is the author's response to discussant. The AP meetings do away with this -- or rather, the author can respond if someone in the audience raises his or her hand and says "I'd like to hear your response to x." That actually happened! But by and large the AP meetings preserve time and a tradition of very active participation and discussion, and this one was no different.
Selasa, 15 Desember 2015
Tilting at Bubbles
 |
| Source: Wall Street Journal |
I thought I was reading The Onion. There it is, a graph marked "Asset Bubbles," measured, apparently, with interferometer precision.
I must have been asleep or something, since the last time I touched base with finance, mid-yesterday, we still didn't have an operational definition of "bubble," let alone a way of measuring one, beyond academics and Fed officials looking out their office windows and opining that prices seem awfully high (but not quite enough for them to put on a big short.) Let alone any scientific understanding of what policies might calm such bogeymen. How does the Fed know a "bubble" from a "boom," an "irrational valuation" from a rational willingness to take risk in a slow but steady real economy?
And, much more importantly, when did it become the Fed's job to diagnose and prick its perceptions of asset price "bubbles?"
Yet here we read
Six years after the financial crisis ended, the central bank remained ill-equipped to quell the kind of dangerous asset bubbles that destabilized the savings-and-loan industry during the late 1980s, tech stocks in the 1990s and housing in the mid-2000s.
...financial bubbles have been root causes of the past three recessions
Iowa farmland prices rose 28% between the fourth quarter of 2010 and the fourth quarter of 2011, igniting fears of a dangerous bubbleApparently "bubbles" have made their way from Monday-morning quarterbacking to established and measurable facts. (To clarify, this is a news story not an editorial, and the reporters, Jon Hilsenrath and David Harrison, are just passing on what they hear. )
Commercial real-estate prices are soaring and Fed officials face the conundrum of what, if anything, to do.
Fed officials said afterward they saw they lacked clear-cut tools or a proper road map of regulatory measures to help stem the simulated booms.
Even though many Fed officials favor using regulatory powers over interest rates to stop bubbles, the U.S. was a “long way” from establishing a regulatory system that could achieve that, Mr. Dudley said in September.Your darn tootin' they face that conundrum. Because diagnosing the sources of, and controlling, asset and real estate prices is not, and never has been, part of the Fed's job.
The Fed has great power and independence. The price of that power and independence is limited sphere of action. It's also wise. Once the Fed becomes the central planner of real estate prices, and allocator of credit to control prices, it will neatly be sandwiched into a political role. Sellers and developers want more, and chant "prices are depressed, stimulate." Buyers want less and chant "pop this bubble" (but give me credit to buy.) The only possible answer is, real estate prices are just not our business.
Central banks have always been severely limited by statute and tradition to what they can try to control, and what tools they can use, in return for their independence. Traditionally, the central bank bought only short-term treasuries, and controlled only short-term interest rates, and its targets were limited to inflation and employment. Intervening in mortgage backed security and long term treasury markets is already a stretch. Using interest rates to target asset prices is a stretch. Using regulatory power, to allocate credit, to control real estate prices, is way, way beyond the Fed's mandate.
Memo to Fed: There is already a chorus angry at how much you exceed your sphere now. You may regard them as ill-informed peasants with pitchforks, but they happen to occupy seats in Congress and they're writing bills. If you decide to judge whether the price of farmland in Iowa is a "bubble," and to use your regulatory powers to stifle credit to Iowa farmers with the goal of determining the just price of farmland, those peasants with pitchforks aren't going to take it quietly.
The Fed has neither authority, mandate, road map, nor regulatory measures, because controlling real estate prices is no more its job than controlling carbon emissions. Congress could change that, and give the Fed broad authority. But it has not done so.
To be fair, perhaps this is a natural extension. The Fed took on the job of propping up house, bond, and arguably stock prices in the recession, and there is not a huge outburst of complaint. Perhaps therefore it is entitled to tamp down house, bond, and stock prices in a boom, if it so desires. Oh wait, there is a huge outburst of complaint.
Mr. Rosengren [president of the Boston Fed] had noticed more building cranes in Boston.
“Given our low interest rates, given that it is an interest-sensitive sector, it is probably worthwhile to start thinking about at what point do we become concerned that is growing too rapidly,” he said.
The Fed’s low interest-rate policies have helped drive investors into such assets as commercial real estate as they search for higher returns.
Fed officials said afterward they saw they lacked clear-cut tools or a proper road map of regulatory measures to help stem the simulated booms. (Repeated, with emphasis)The vague rationale for intervention is that there is a difference between "boom" and "bubble," between asset prices that are high because of "real" valuations vs. "irrational" ones, between something like "supply" and "demand" and somehow the Fed can tell in real time, offset the bad and allow the good. But that all disappeared in the above paragraphs. Boom and bubble are now the same. And we're not even talking about national or "systemic" "bubbles" anymore. Now the Fed is supposed to worry about the price of farmland in Iowa
This is how it's supposed to work. The Fed lowered interest rates, that raises asset values, higher asset values induce people to invest, which is "stimulative." Q theory 101. How do we know it's "too much?"
Despite the action in commercial real estate, debt levels across the broader financial system are still modest. Overall U.S. financial sector debt— $15.2 trillion in the second quarter—was down 16% from the third quarter of 2008. Financial sector debt has fallen to 84% of economic output from 125%, a sign the economy is less prone to a financial crisis on the scale of 2008.
“Our quantitative measures indicate a subdued level of overall vulnerability in the U.S. financial system,” Fed economists said in an August research paper that sought to assess risks of banks and markets overheating.Now we're getting somewhere. How are asset price gyrations a "risk" anyway? Answer: if and only if they make their way through debt to default and runs. The right answer to such worries is to make sure there isn't a lot of debt in the way, and let asset prices do whatever they want to do. Keep people from storing gas in the basement; don't try to stop them from ever lighting a candle. The project that the Fed will micro manage prices so nobody ever loses money again is hopeless.
And the bottom graph looks pretty darn good. So what is the worry? If there is no debt in the way, why must the Fed try to control prices?
Some of them, including Ms. George [president of the Federal Reserve Bank of Kansas City] said rates weren’t the right instrument to use against bubbles. She favored demanding banks hold more capital.Excellent! (I presume she was misquoted, as banks issue capital, they don't hold it, but a minor quibble.)
The graph: I looked up the original here, in a nice paper titled "Mapping Heat in the U.S. Financial System." The paper does not pretend to define or measure "bubbles." It's a nice index number/visualization/forecasting exercise with many more pretty graphs.
Senin, 30 November 2015
Fixed-income comments
A month ago, I attended the SF Fed/Bank of Canada conference on fixed income. I had the chance to comment on Michael Bauer and Jim Hamilton's "Robust Bond Risk Premia.” My comments here.
As usual when faced with a really nice paper, I used most of my discussion time to survey the field and give my views on current facts and challenges, which is why my comments might be interesting to blog readers.
Some highlights: I reran regressions of bond returns in the style of Joslin, Priebsch, and Singleton, forecasting returns with the first three principal components of yields, and growth and inflation. Here are the results:

First row: the slope factor forecasts returns with the usual 18% R2. Second row: Inflation and growth do not forecast returns at all. Third row: in combination with the first three principal components, the R2 rises to 0.26 by adding growth and inflation. Inflation now becomes a significant predictor, and its presence raises the coefficient and t statistic on the level and slope factors. This is an interesting OLS puzzle.
If you plot inflation, you see it is mostly a downward trend in this sample period. So, it occurred to me, what if I used a trend instead? The last two rows of the table add a trend. Indeed, with the trend, growth and inflation disappear. In fact, we can drop growth, inflation, and the third principal component, forecast returns with amazing t statistics and an R2 of 0.62, which must be an all time high.
What's going on here? Is the trend just picking up a trend in returns? Here is a plot of expected returns (a + b x_t) and actual returns (r_t+1) for four of the models in Table 1.

The point: the trend is not just picking up a trend in returns. And the 62% R2 is not a pathology of one big outlier, a trend, or something else. Instead, the trend serves to filter the level factor, and to a lesser extent the slope factor. The message is not "a trend seems to forecast a trend in returns" but "the cyclical variations picked up by detrended level and slope factors seem to forecast returns."
So what does this all mean? Is this proof growth and inflation don't work because they are driven out by trends? No, the trend is after all a proxy for something economic. (This is roughly Cieslak and Povala's point, who get over 50% R2 in a longer sample with smoothed inflation.) Is this all a big econometric goof, because serially correlated right hand variables are a mistake? No, and my comments go into this at length. Bauer and Hamilton's point is this econometric problem, but they don't get close to t statistics of 10. OLS cares about serial correlation of the residuals, but not of the right hand variables. In the end, it's a interpretation issue, not an econometric one.
The biggest point of my comments: It's time to get past forecasting returns one at a time. Classic finance got past "is AT&T a good investment?" in the 1960s, after all, and moved on to portfolios and covariances. Here, the more interesting outstanding question is the factor structure of expected returns -- do expected returns on all bonds move together over time? -- and the risk premium question -- what are the factors, covariance with which drives that variation in expected returns?
To this question, perhaps we should take a lesson from the VAR literature of the 1980s, and stop worrying tremendously about equation by equation parsimony in forecasting. Instead, accept that forecasting regressions will be a somewhat overfit, but put our attention in the cross-equation structure of forecasts.
To be specific, the next graph shows the expected returns of bonds with maturity 1-10 years -- the fitted value of each bond's return-forecasting regression. The graph is clear: these are not 10 different series. The expected returns on all bonds move in lockstep. There is a strong one-factor structure in expected returns.

Finance 101: Expected return = covariance of return with something, times risk premium. What's that something? In this context, the bonds whose expected return moves most over time should have returns that covary proportionally more with some factor. What is it? The next picture plots how much each bond moves with the common factor shown in Figure 11 against the covariance of the 10 bond returns with innovations in the bond principal components, growth, and inflation.

Again, the pattern is pretty clear: time-varying expected return corresponds completely with covariances with the level factor. Covariances with the other factors are all about zero, and do not vary in the same way as expected returns.
In sum, this simple exploration shows a pretty strong pattern: 1) There is a strong one-factor model of expected returns -- expected returns on bonds of all maturity move together over time. 2) There is a strong one-factor model of risk: the single time-varying risk premium in all bonds corresponds to covariance with a single factor, innovations to the level of interest rates.
This is all very simplified of course. The point: This kind of characterization of the joint behavior of bonds of various maturities -- and later of bonds, stocks, and foreign exchange -- seems like a more interesting unanswered question than the precise identity of forecasting variables for each security, taken in isolation.
These points are a bit of a rehash of older papers, Decomposing the yield curve and more generally Discount Rates. But they are also an extension --- the "Decomposing the yield curve" point holds using the JPS forecasters and factors, and updated data. This kind of inquiry needs a lot more work.
As usual when faced with a really nice paper, I used most of my discussion time to survey the field and give my views on current facts and challenges, which is why my comments might be interesting to blog readers.
Some highlights: I reran regressions of bond returns in the style of Joslin, Priebsch, and Singleton, forecasting returns with the first three principal components of yields, and growth and inflation. Here are the results:

First row: the slope factor forecasts returns with the usual 18% R2. Second row: Inflation and growth do not forecast returns at all. Third row: in combination with the first three principal components, the R2 rises to 0.26 by adding growth and inflation. Inflation now becomes a significant predictor, and its presence raises the coefficient and t statistic on the level and slope factors. This is an interesting OLS puzzle.
If you plot inflation, you see it is mostly a downward trend in this sample period. So, it occurred to me, what if I used a trend instead? The last two rows of the table add a trend. Indeed, with the trend, growth and inflation disappear. In fact, we can drop growth, inflation, and the third principal component, forecast returns with amazing t statistics and an R2 of 0.62, which must be an all time high.
What's going on here? Is the trend just picking up a trend in returns? Here is a plot of expected returns (a + b x_t) and actual returns (r_t+1) for four of the models in Table 1.

The point: the trend is not just picking up a trend in returns. And the 62% R2 is not a pathology of one big outlier, a trend, or something else. Instead, the trend serves to filter the level factor, and to a lesser extent the slope factor. The message is not "a trend seems to forecast a trend in returns" but "the cyclical variations picked up by detrended level and slope factors seem to forecast returns."
So what does this all mean? Is this proof growth and inflation don't work because they are driven out by trends? No, the trend is after all a proxy for something economic. (This is roughly Cieslak and Povala's point, who get over 50% R2 in a longer sample with smoothed inflation.) Is this all a big econometric goof, because serially correlated right hand variables are a mistake? No, and my comments go into this at length. Bauer and Hamilton's point is this econometric problem, but they don't get close to t statistics of 10. OLS cares about serial correlation of the residuals, but not of the right hand variables. In the end, it's a interpretation issue, not an econometric one.
The biggest point of my comments: It's time to get past forecasting returns one at a time. Classic finance got past "is AT&T a good investment?" in the 1960s, after all, and moved on to portfolios and covariances. Here, the more interesting outstanding question is the factor structure of expected returns -- do expected returns on all bonds move together over time? -- and the risk premium question -- what are the factors, covariance with which drives that variation in expected returns?
To this question, perhaps we should take a lesson from the VAR literature of the 1980s, and stop worrying tremendously about equation by equation parsimony in forecasting. Instead, accept that forecasting regressions will be a somewhat overfit, but put our attention in the cross-equation structure of forecasts.
To be specific, the next graph shows the expected returns of bonds with maturity 1-10 years -- the fitted value of each bond's return-forecasting regression. The graph is clear: these are not 10 different series. The expected returns on all bonds move in lockstep. There is a strong one-factor structure in expected returns.

Finance 101: Expected return = covariance of return with something, times risk premium. What's that something? In this context, the bonds whose expected return moves most over time should have returns that covary proportionally more with some factor. What is it? The next picture plots how much each bond moves with the common factor shown in Figure 11 against the covariance of the 10 bond returns with innovations in the bond principal components, growth, and inflation.

Again, the pattern is pretty clear: time-varying expected return corresponds completely with covariances with the level factor. Covariances with the other factors are all about zero, and do not vary in the same way as expected returns.
In sum, this simple exploration shows a pretty strong pattern: 1) There is a strong one-factor model of expected returns -- expected returns on bonds of all maturity move together over time. 2) There is a strong one-factor model of risk: the single time-varying risk premium in all bonds corresponds to covariance with a single factor, innovations to the level of interest rates.
This is all very simplified of course. The point: This kind of characterization of the joint behavior of bonds of various maturities -- and later of bonds, stocks, and foreign exchange -- seems like a more interesting unanswered question than the precise identity of forecasting variables for each security, taken in isolation.
These points are a bit of a rehash of older papers, Decomposing the yield curve and more generally Discount Rates. But they are also an extension --- the "Decomposing the yield curve" point holds using the JPS forecasters and factors, and updated data. This kind of inquiry needs a lot more work.
Kamis, 12 November 2015
Permazero
St. Louis Fed President Jim Bullard gave a very interesting paper at the Cato monetary conference, with this great title.

Jim starts with this great picture. It's a simulation of the standard three equation new Keynesian model as we go from 2% interest rate to zero. This is an upside down version of the first graph in my "Do higher interest rates raise or lower inflation." (Blog post) But Jim makes a new and insightful point with it, that had not occurred to me.
Jim reads this as an account of what happened in 2008, not (my) tentative prediction for what might happen in 2016 in the other direction. It's compelling: The Fed lowers rates. This boosts output (black line) over what it would otherwise be, overcoming the horrendous negative shocks to the economy from a financial crisis. Inflation gently declines, which is also what inflation did after a one time shock in 2009, related to the output shock which the Fed was offsetting.

Jim then ties that together with my Figure 3 in an artful way. The same model that accounts well for slow disinflation in the recovery suggests that raising rates now, in the absence of other shocks, would just raise inflation and lower output.

Jim goes on to present some data averaged across a variety of countries. Here you see a pattern quite similar to the model's prediction. After recovering from the severe shock, inflation starts its gentle decline.
Like me, Jim is nervous about these conclusions. The data seem to be telling us that interest rate pegs are not unstable. The standard model turns out to have that prediction, but also predicts that raising interest rates, while lowering output as we have long been told, will just smoothly raise inflation. It's very hard to turn around decades of contrary doctrine -- that pegs are unstable, and raising rates lowers inflation. One should be nervous about such conclusions. Maybe inflation is, finally, just around the corner. So Jim makes very clear he's not yet recommending a rate rise to cause more inflation!
But one should also start thinking about what these conclusions mean if they are right, and Jim summarizes with a number of such implications. A few that seem especially important, with comment:
Just what is so terrible about zero rates and very low inflation? Zero rates are the optimum quantity of money. They have financial stability benefits too. Banks sitting on huge piles of cash don't go under.
Conventional modeling has been treating the zero bound as a "trap," or a terrible outcome to be avoided. But it's a honey trap, at least in these models. The main complaint one could make is that they don't last, that they lead to spiraling deflation or hyperinflation. But the models said "trap" -- they last -- and the data seem to agree.
And this is a simple problem to solve in the theory. Add back the missing fiscal theory of the price level -- deliberately thrown out in the theory -- and you have determinacy again. In words, a jump to an alternative equilibrium requires that fiscal policy expectations also jump. If people's expectations of long-term fiscal policy are stable, then we have determinacy and no more volatility at the zero bound too.

Jim starts with this great picture. It's a simulation of the standard three equation new Keynesian model as we go from 2% interest rate to zero. This is an upside down version of the first graph in my "Do higher interest rates raise or lower inflation." (Blog post) But Jim makes a new and insightful point with it, that had not occurred to me.
Jim reads this as an account of what happened in 2008, not (my) tentative prediction for what might happen in 2016 in the other direction. It's compelling: The Fed lowers rates. This boosts output (black line) over what it would otherwise be, overcoming the horrendous negative shocks to the economy from a financial crisis. Inflation gently declines, which is also what inflation did after a one time shock in 2009, related to the output shock which the Fed was offsetting.

Jim then ties that together with my Figure 3 in an artful way. The same model that accounts well for slow disinflation in the recovery suggests that raising rates now, in the absence of other shocks, would just raise inflation and lower output.

Jim goes on to present some data averaged across a variety of countries. Here you see a pattern quite similar to the model's prediction. After recovering from the severe shock, inflation starts its gentle decline.
Like me, Jim is nervous about these conclusions. The data seem to be telling us that interest rate pegs are not unstable. The standard model turns out to have that prediction, but also predicts that raising interest rates, while lowering output as we have long been told, will just smoothly raise inflation. It's very hard to turn around decades of contrary doctrine -- that pegs are unstable, and raising rates lowers inflation. One should be nervous about such conclusions. Maybe inflation is, finally, just around the corner. So Jim makes very clear he's not yet recommending a rate rise to cause more inflation!
But one should also start thinking about what these conclusions mean if they are right, and Jim summarizes with a number of such implications. A few that seem especially important, with comment:
Third, longer‐run economic growth would still be driven by human capital accumulation and technological progress, as always, but without the accompanying stabilization policy as conventionally practiced from 1984‐2007. In principle, the economy would still be expected to grow at a pace dictated by fundamentals.A little more bluntly, Japan-bashers cannot blame 20 years of poor growth on the zero bound. Nor should we worry that permazero will cause lower growth. (The other way around is much more likely: low marginal product of capital leads to low rates.) Japan's growth and inflation, like our own for the last seven years, has also been quite stable, raising the next question of just how much stabilization this policy was doing.
Fourth, the celebrated Friedman rule would arguably be achieved, so that household and business cash needs are satiated. In many monetary models this is a desirable state of affairs.Yes!! Shout it from the rooftops.
Just what is so terrible about zero rates and very low inflation? Zero rates are the optimum quantity of money. They have financial stability benefits too. Banks sitting on huge piles of cash don't go under.
Conventional modeling has been treating the zero bound as a "trap," or a terrible outcome to be avoided. But it's a honey trap, at least in these models. The main complaint one could make is that they don't last, that they lead to spiraling deflation or hyperinflation. But the models said "trap" -- they last -- and the data seem to agree.
Fifth, the risk of asset price fluctuations may be high. In the New Keynesian model, the near‐zero interest rate policy with little or no response to incoming shocks is associated with equilibrium indeterminacy. This means there are many possible equilibria, all of which are consistent with rational expectations and market clearing. In a nutshell, a lot of things can happen. Many of the possible equilibria are exceptionally volatile. One could interpret this theoretical situation as consistent with the idea that excessive asset price volatility is a risk.This is spot on. In the models, the trouble with the zero bound "trap" is not high unemployment, low growth, or spiraling inflation or deflation -- it has none of these. The problem is "indeterminacy," the possibility that inflation can bounce around a bit, each time returning stably back again. That's also what we seem to see, and it hasn't been a huge problem: We don't see any more inflation, output, or asset market volatility in the last 7 years than in the period before the crisis.
And this is a simple problem to solve in the theory. Add back the missing fiscal theory of the price level -- deliberately thrown out in the theory -- and you have determinacy again. In words, a jump to an alternative equilibrium requires that fiscal policy expectations also jump. If people's expectations of long-term fiscal policy are stable, then we have determinacy and no more volatility at the zero bound too.
Sixth, and finally, the limits on operating monetary policy through ordinary short‐term nominal interest rate adjustment in this situation would surely continue to fire a search for alternative ways to conduct monetary stabilization policy. The favored approach during the past five years within the G‐7 economies has been quantitative easing, and there would surely be pressure to use this or related tools.I.e. in permazero, eventually markets get tired of reacting to whispers that the Fed might someday raise rates. Monetary policy overall becomes ineffective, leading central banks to try other levers. Which may not be such a great idea!
Selasa, 10 November 2015
Taylor Truman Medal Speech
John Taylor's speech on receiving the Truman medal for economic policy is noteworthy. John thinks about the institutions that govern monetary and financial policy. We spend too much time on the will-she-raise-rates-or-won't-she sort of decisions that we forget how important this institutional structure is to good, predictable and (as John might put it) rule-based policy.
John reflects on the institutions of postwar policy:
Prewar problems:
The restoration of order in the 1980s featured important reforms to monetary and fiscal policies internationally, and the Bretton Woods institutions (IMF, CEA, etc.) may have had something to do with it. But Bretton Woods was gone.
Bretton Woods did, however, help to keep the chaos of the 1930s from returning. John's point may be that bad rules are better than no rules.
On to the present:
Last but not least, international economic policy and foreign policy are intertwined. The Bretton Woods generation understood that.
John reflects on the institutions of postwar policy:
Seventy years ago Harry Truman signed the Bretton Woods Agreements Act of 1945. It officially created two new economic institutions: the International Monetary Fund and the World Bank. A year later he signed the Employment Act of 1946. It created two more new institutions: the President’s Council of Economic Advisers (CEA) and the Congress’s Joint Economic Committee (JEC). And in 1947 came the General Agreement on Tariffs and Trade (GATT) and the Truman Doctrine, and in 1948 the Marshall Plan.
Prewar problems:
... One serious economic evil leading up to World War II arose from competitive devaluations and currency wars...
A second economic evil stemmed from extensive “exchange controls,” in which importers of goods were forced to make payments to a government monopoly in foreign exchange. The government would determine what types of goods could be imported and how much to pay exporters. Exchange controls also involved multiple exchange rates, government licenses to export and import, and even officially conducted barter trade. They deviated from the principles of economic freedom, and caused all sorts of distortions and injustices...Bretton Woods:
Each country—each party to the agreement—would commit to two basic monetary rules... First, they would swear off competitive devaluations by agreeing that any exchange rate change over 10% from certain values, or pegs, would have to be approved by a newly-created IMF. ... It was called an adjustable peg system.
Second, countries agreed to remove their exchange controls, with a transition period because many had extensive controls in place. The countries, however, did not agree to remove capital controls, which include restrictions on making loans, buying or selling bonds, and equity investments.John's judgement:
In important respects the blueprint succeeded. Exchange controls were removed, though it took more than a decade, and the currency wars ended, though the adjustable peg system itself fell apart in the 1970s and gave way to a flexible exchange rate system. The 1970s were difficult because monetary policy lost its rules-based footing and both inflation and unemployment rose.
But in the 1980s and 1990s policy became more focused and rules-based and economic performance improved greatly. Though not part of the blueprint, virtually all the developed countries that signed the original agreement—and others like Germany and Japan—also abandoned capital controls. By the late 1990s, many emerging market countries were adopting rules-based monetary policies, usually in the form of inflation targeting, and entered into a period of stability. Some emerging market countries, such as Brazil, began to remove capital controls, and the IMF recommended adding their removal to the articles of agreement.I'm a bit skeptical of this judgement. (And I think I've persuaded John, so we'll see what happens in later writings.) Bretton Woods featured pegged exchange rates, something of a gold standard to the dollar, and capital controls to lessen exchange rate pressures. All three blew up by 1970. The basic structure of Bretton Woods failed.
The restoration of order in the 1980s featured important reforms to monetary and fiscal policies internationally, and the Bretton Woods institutions (IMF, CEA, etc.) may have had something to do with it. But Bretton Woods was gone.
Bretton Woods did, however, help to keep the chaos of the 1930s from returning. John's point may be that bad rules are better than no rules.
On to the present:
Unfortunately this benign situation has not held, and today the challenges facing the international monetary system eerily resemble those at the time of the creation...
Consider currency movements. Quantitative easing (QE) started in earnest in 2009 in the United States. It was followed by a period where the dollar was low relative yen. It was followed by QE in Japan in 2013 which depreciated the yen, as was the expressed intent of Japan governor Haruhiko Kuroda. That was followed by QE in the Eurozone in 2014 which depreciated the euro, as was the expressed intent of ECB president Mario Draghi. The dollar- yen-euro story from 2009 to 2014 looks a lot like the pound-dollar-lira story from 1931 to 1936, even though U.S policy makers today consider the exchange rate effect to be by-products of their actions, not the direct intent. So QE begets QE, which begets QE, and so on.There is a big challenge understanding just how QE affects currencies. Notice John says "followed by." But if you regard QE as signals of future interest rates, it is easier to understand. Exchange rates are a sort of present value of future interest differentials. Continuing
Interest rate decisions at central banks around the world also resemble currency wars. Whether you ask them or watch them, you can tell that central bankers are following each other. Extra low U.S. interest rates were followed by extra low interest rates in many other countries, in an effort to prevent sharp currency appreciations. Those low interest rates appear to have resulted in a boom-bust pattern in emerging market countries evident in the recent commodity cycle...
Capital also flows in response to interest rate differentials—even if attenuated by policy reactions. .. A host of government interventions and restrictions on housing markets have been used to prevent the low interest rates from causing bubbles. Macro-prudential regulations, which have legitimate purposes, are also being used to counter the effects of the low interest rates.Worse,
There’s also been a revival of capital controls. Even the IMF has endorsed capital controls, calling them “capital flow management” or CFM for short.John's conclusion
In my view we need a new strategy to deal with these problems.
So as in the 1940s we should forge an agreement where each country commits to certain rules...
. A second reform would set up rules for eventually removing capital controls. Currently, 36 countries now have open capital accounts, but 48 are classified as “gate” countries and 16 as “wall” countries with varying degrees of capital controls.John rethinks the role of the 40s institutions.
.. recreating the ‘40s founded institutions for today’s global economy must go beyond the IMF. The World Bank was originally created to supplement private capital flows for reconstruction and development. But today capital flows and savings to finance investment are abundant—some even see a glut.He goes on to rethink the roles of CEA, JEC, GATT, WTO, and so forth.
Last but not least, international economic policy and foreign policy are intertwined. The Bretton Woods generation understood that.
...we see the same international cross-border encroachment on freedom, including economic freedom. In my view the United States should commit to promoting economic freedom as part of its foreign policy strategy. It should also strongly support economic leaders who are committed to economic freedom in their own countries. This is the lesson learned from the transitions from government control to market economies two decades ago, especially in Poland. The U.S. government strongly supported Polish economic reforms—the removal of price controls, of barriers to new businesses, and of subsidies of old state enterprises, along with a restoration of the rule of law and property rights. Today international support packages tend to do just the opposite: encourage more government subsidies and controls.It is amazing just how much of the international financial and monetary architecture resides in institutions set up in the 1940s. Good rules need good institutions. But institutions need rethinking on occasion.
Minggu, 08 November 2015
The 13 Trillion Dollar Question
On Tuesday Nov 10 there will be a conference in Chicago on "The $13 Trillion Question: Managing the U.S. Government’s Debt" hosted by the Initiative on Global Markets at Chicago Booth, and the Hutchins Center on Fiscal and Monetary Policy at Brookings. (The Brookings announcement here.)
Robin Greenwood will present "The Optimal Maturity of Government Debt and Debt Management Conflicts between the U.S. Treasury and the Federal Reserve" arguing that the Fed and Treasury are working to cross-purposes -- the Fed buys what the Treasury sells -- and that the government should go after low rates on long term bonds rather than the budget insurance of issuing long term bonds.
(The government faces the same decision a homeowner does: borrow at near-zero floating rates, but maybe rates shoot up and so do your payments, or borrow long at 2% rates, and pay more if rates don't go up. Robin and Larry favor the former. I'm more risk averse. Maybe living in California has sensitized me that just because you haven't seen an earthquake recently doesn't mean you shouldn't buy earthquake insurance. But it's a good argument to have qualitatively -- what's the risk, and what's the reward.)
I will present "A new structure for Federal Debt," arguing for an overhaul of which instruments the Treasury issues, to make them more useful for financial markets and financial stability as well as for government borrowing and risk management. (Earlier blog post about this paper here.)
There will be extensive discussion and broader issues, and (the big draw) a panel of Seth Carpenter, Charles Evans, and Sara Sprung, moderated by David Wessel.
The conference is by invitation, but you can still sign up here until they run out of room, or email Jennifer (dot) Williams at chicagobooth (dot) edu. It will also be viewable by live webcast, link here, starting 1:30 central.
Update: Video of the event here.
Program
Session I - The Optimal Maturity of Government Debt and Debt Management Conflicts between the U.S. Treasury and the Federal Reserve
Speakers
Robin Greenwood, George Gund Professor of Finance and Banking, Harvard Business School
Samuel G. Hanson, Assistant Professor of Business Administration, Harvard Business School
Discussant
Guido Lorenzoni, Breen Family Professor, Northwestern University
Moderator
Austan Goolsbee, Robert P. Gwinn Professor of Economics, University of Chicago Booth School of Business
Session II - A New Structure for U.S. Federal Debt
Speaker
John H. Cochrane, Senior Fellow, Hoover Institution and Distinguished Senior Fellow, University of Chicago Booth School of Business
Discussant
James J. McAndrews, Executive Vice President, Federal Reserve Bank of New York
Moderator
Anil K Kashyap, Edward Eagle Brown Professor of Economics and Finance, University of Chicago Booth School of Business
Session III - Panel Discussion
Panelists
Seth B. Carpenter, Assistant Secretary for Financial Markets, Department of the Treasury
Charles Evans, President and Chief Executive Officer, Federal Reserve Bank of Chicago
Sara Sprung, Managing Director, Neuberger Berman
Moderator
David Wessel, Director, The Hutchins Center on Fiscal and Monetary Policy, Brookings Institution
Robin Greenwood will present "The Optimal Maturity of Government Debt and Debt Management Conflicts between the U.S. Treasury and the Federal Reserve" arguing that the Fed and Treasury are working to cross-purposes -- the Fed buys what the Treasury sells -- and that the government should go after low rates on long term bonds rather than the budget insurance of issuing long term bonds.
(The government faces the same decision a homeowner does: borrow at near-zero floating rates, but maybe rates shoot up and so do your payments, or borrow long at 2% rates, and pay more if rates don't go up. Robin and Larry favor the former. I'm more risk averse. Maybe living in California has sensitized me that just because you haven't seen an earthquake recently doesn't mean you shouldn't buy earthquake insurance. But it's a good argument to have qualitatively -- what's the risk, and what's the reward.)
I will present "A new structure for Federal Debt," arguing for an overhaul of which instruments the Treasury issues, to make them more useful for financial markets and financial stability as well as for government borrowing and risk management. (Earlier blog post about this paper here.)
There will be extensive discussion and broader issues, and (the big draw) a panel of Seth Carpenter, Charles Evans, and Sara Sprung, moderated by David Wessel.
The conference is by invitation, but you can still sign up here until they run out of room, or email Jennifer (dot) Williams at chicagobooth (dot) edu. It will also be viewable by live webcast, link here, starting 1:30 central.
Update: Video of the event here.
Program
Session I - The Optimal Maturity of Government Debt and Debt Management Conflicts between the U.S. Treasury and the Federal Reserve
Speakers
Robin Greenwood, George Gund Professor of Finance and Banking, Harvard Business School
Samuel G. Hanson, Assistant Professor of Business Administration, Harvard Business School
Discussant
Guido Lorenzoni, Breen Family Professor, Northwestern University
Moderator
Austan Goolsbee, Robert P. Gwinn Professor of Economics, University of Chicago Booth School of Business
Session II - A New Structure for U.S. Federal Debt
Speaker
John H. Cochrane, Senior Fellow, Hoover Institution and Distinguished Senior Fellow, University of Chicago Booth School of Business
Discussant
James J. McAndrews, Executive Vice President, Federal Reserve Bank of New York
Moderator
Anil K Kashyap, Edward Eagle Brown Professor of Economics and Finance, University of Chicago Booth School of Business
Session III - Panel Discussion
Panelists
Seth B. Carpenter, Assistant Secretary for Financial Markets, Department of the Treasury
Charles Evans, President and Chief Executive Officer, Federal Reserve Bank of Chicago
Sara Sprung, Managing Director, Neuberger Berman
Moderator
David Wessel, Director, The Hutchins Center on Fiscal and Monetary Policy, Brookings Institution
Inequality and Economic Policy Published
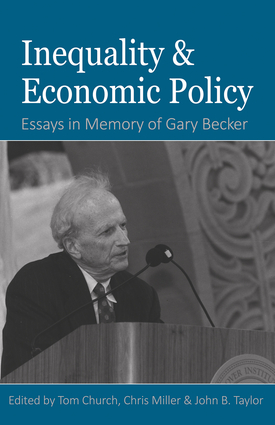
This includes the published version of my essay Why and How We Care about Inequality, also available on my webpage. Bryan Caplan was kind enough to cover it positively last week, now you can read the original. I put a draft up on this blog last year, so I won't repeat it all today. As usual, the published version is better.
The rest of the contents:
Chapter 1: Background Facts By James Piereson
Chapter 2: The Broad-Based Rise in the Return to Top Talent By Joshua D. Rauh
Chapter 3: The Economic Determinants of Top Income Inequality By Charles I. Jones
Chapter 4: Intergenerational Mobility and Income Inequality By Jörg L. Spenkuch
Chapter 5: The Effects of Redistribution Policies on Growth and Employment By Casey B. Mulligan
Chapter 6: Income and Wealth in America By Kevin M. Murphy and Emmanuel Saez
Chapter 7: Conclusions and Solutions By John H. Cochrane, Lee E. Ohanian, and George P. Shultz
Chapter 8: Contents by Edward P. Lazear adn George P. Shultz
Kamis, 01 Oktober 2015
Uncle Sam Spam

Applebaum's article reflects much of the usual New York Times cheerleading for behaviorism and nudge/nanny programs.
Reading the report, I came away more approving of some aspects than blog readers might think, but a little more skeptical of some aspects than Applebaum's article.
- The bottom line is spam. The government wants to send you letters, email, and text messages to sell its programs. The limits and objections to the program are pretty obvious once you recognize that fact. Spam gets ineffective pretty quickly, and once we start getting spam from 150 different programs nudging us to do different things, spam will get even more ineffective even more quickly.
- If it's a good idea for the government to send us spam email and text messages, why are academic behavioral scientists the ones to do it, not professional spammers (sorry, "direct marketers")? The actual end result of this is more employment and consulting contracts for academic behavioral economics.
- The numbers in the report are surprisingly small. Sending spam raises the number of people taking advantage of some program from 2% to 2.2%, which can be sold as a 10 percent increase. Even I, somewhat of a skeptic to start, am amazed how low the effects are. And both before and after numbers are incredibly small. The big news in this report is that we're full of government programs that only a few percent of the available people are taking advantage of! That might be great news for the budget, but shocking news of effectiveness.
Research from behavioral science demonstrates that seemingly small barriers to engagement such as hard to- understand information, burdensome applications, or poorly presented choices can prevent programs from working effectively for the very people they are intended to serve (xi)Well, that seems completely unobjectionable. Anyone who has tried to fill out any government form or understand any government program, regulation, the tax code, or much of anything else can sympathize with the idea that it is insanely complex and obscure. And duh, that complexity is hindering its effectiveness.
It also seems breathtakingly obvious. Do we really need "research from behavioral science" to know that?
It also seems a little paternalistic of government. In a little google searching, the word "Byzantine" comes from crusader's complaints about the complexity of the Byzantine empire. "Red tape" goes back to the 1400s. This has been going on a long time. Is the fact that government programs are absurdly complicated simply because the bureaucrats who run them are so dumb they don't know that complex stuff doesn't work?
It's easy to suspect that many parts of our government, like the tax code, are deliberately complex and obscure, to keep us peasants from figuring out what's really going on, and to keep an army of government bureaucrats, lobbyists, attorneys, and various fixers employed. That will be harder to fix than just by parachuting in some academic consultants to craft spam emails.
Though the report trumpets "behavioral science" as having all the answers, most of the actual programs involve testing 9 or 10 bright ideas, and then reporting the most successful one.
"this process of translation requires constant evaluation and feedback. SBST works with agencies to, where possible, rigorously test the impact of these insights on program outcomes before implementing them widely. In this way, SBST can learn about what works, what works best, and what does not work. To achieve this goal, SBST often implements randomized trials?Again, these are wise words. Again, they are blisteringly obvious. Again, the fact that most government programs do NO retrospective analysis, no quantiative evaluation of methods, no measurement at all of this sort is damning by its absence. Google, Amazon, and Facebook are constantly trying different ways of presenting information and picking the winners.
Well, enough whining. Maybe by coming in with a gloss of "behavioral science" and a big program they can get agencies to clean up their acts a bit, raise participation in good programs above 5% sorts of numbers and do a modicum of analysis. (Though with this branch of psychology in a crisis of replicability, whether that piece of marketing is wise is another good question.)
But I read over the successes trumpeted in the report, they sadly melted away. Start with perhaps the most important, and the biggest success: getting low-income kids to college. The effort was a big success, you read early on,
"helping more low-income students get to college each year. "(iii)In fact, thanks to the pilot programs alone,
"college is now more readily accessible to millions of American families.? (xi)Hmm. "Accessible" doesn't actually mean "accessed."
What did they actually do? One problem, "summer melt" is kids who start applying to colleges, don't fill out all the forms over the summer, and then don't show up. (The report says they don't go to college "because" they did not fill out the form, but with no evidence for this strong statement. People who are not going to go to college for other reasons don't fill out forms.) To help,
. uAspire sent a series of eight text messages informed by behavioral insights to a random sample of students over the summer months, boosting college enrollment by 3.1 percentage points (from 64.9 percent to 68.0 percent). The impact of the texts was particularly large for the lowest-income students, who saw a 5.7 percentage point increase in college enrollment (from 66.4 percent to 72.1 percent; see Figure 6), ..(P. 9:)I've seen hyperbole before, but a three to five percentage point increase in takeup in response to nagging emails, in a small sample in an experiment, is a long way from having already made "college more readily accessible to millions of American families."
And how many of those extra students made it past the first week? How do we know they "successfully" enrolled in college? None of these studies reports any follow up.
Of course, it's hard to object. If all it takes is some text messages to get 72 rather than 66 percent of low income kids to make it to the first day of classes, that's good. Any parent of a teenager will be quick to tell you that nagging is vitally necessary for this demographic.
The other effects in this report are unbelievably small. Even I would have thought behavioralism could improve things more than this. And even I thought government programs were more effective.
"sent approximately 720,000 unenrolled Servicemembers one of nine email variants, the most effective message nearly doubled the rate at which Servicemembers signed up for TSP. Emails informed by behavioral insights led to roughly 4,930 new enrollments and $1.3 million in savings in just the first month after the emails were sent. .."Let's see, 4930/720,000 = 0.7% That must be "doubled" from 0.35%.
On college loans,
"SBST and FSA sent a reminder email to over 100,000 borrowers who had missed their first payments. The reminder email led to a 29.6 percent increase in the fraction of borrowers making a payment in the first week after it was sent, from 2.7 to 3.5 percent.An increase from 2.7 percent (catastrophically low) to 3.5 percent (only disastrously) is a 29.6 percent increase.
The prize winners:
Farms that were sent a personalized letter were 22 percent more likely to obtain a loan, representing an increase from 0.09 to 0.11 percent.
SBST and the Department of Health and Human Services (HHS) sent one of eight behaviorally designed letter variants to each of more than 700,000 Individuals. Those sent the most effective version of the letter were 13.2 percent more likely to enroll in health insurance than those sent no letter, with enrollment rates of 4.56 and 4.03 percent, respectively.
In addition to the unbelievably tiny rates, it does sound a bit like "Eight magicians reporting ESP abilities were tested. The best of the eight was able to predict 5 out of 10 cards in a row..."
I do have to commend the report for honesty, at least they put the tiny percentages in the summary rather than just present the percent increases in tiny percentages. They make for great case studies in statistics classes on the danger of selling an increase from 0.09% to 0.11% as a big 22% increase. But these are tiny, tiny effects
With these examples, you see my point. What is this about? In a word, spam. The government wants to send you spam emails, spam letters, and spam text messages.
OK, let's use the polite word "marketing." But once put that way, a reaction becomes a bit obvious. Yes, the government needs to do a better job marketing its programs. Is hiring a bunch of behavioral science academics the best way to do this, or is it more effective to hire some real marketing consultants? I'm sure it's better for the academic behavioral scientists who want to feel important or score government contracts, but really, if we're going to be scientific, we should compare letting any good marketing organization compete with the behavioralists in the writing of spam.
Equally obvious, spam might be effective the first time, but rapidly falls off. No wonder we're talking about raising 4.03% to 4.56% responses. The Nigerian princes with a gift for you have been consulting with the same behavioralists.
Spam may be quite difficult to scale. Once all 46 job training programs start sending weekly nudges, how effective will they be? Once you have to wade through nudges to buy an electric car, "clean diesel" (whoops), put solar panels on your roof, fill out your taxes, sign up for that 526 college savings plan, eat more cheese, and on and on, will each have any impact any more? And once the con artists and spammers learn to simulate government emails, and anti-spam programs weed them out, what happens?
This will be harder because so many programs work to cross purposes. I note wryly that the report starts with "boosting retirement savings nationwide" on page 1. Of course the Administration's economic policies have been desperately trying to get Americans not to save and to spend instead, from trillion dollar stimulus to ultra-low interest rates, for 8 years running. So which is it? Or will we soon get contradictory nudges?
In sum, yes, a simpler bureaucracy would be nice. If a few forms get simpler and a few people get help, It's hard to object. If bureaucracies start regularly monitoring the effectiveness of their programs, even better. But is America's problem right now not enough spam?
Will it have a big effect? This seems now mostly a device for behavioral science academics to get funding for more research, chewing up a small amount of Federal dollars and doing little harm along the way.
The good news: I expected grand plans for the Federal Department of Nudging. The effort so far seems limited to trying to get existing government programs to work better.
Selasa, 18 Agustus 2015
The decline in long-term interest rates
 |
| Source: Council of Economic Advisers |
The Council of Economic Advisers just issued an excellent report surveying our understanding of this question. A blog post summary by Maury Obstfeld and Linda Tesar.
(Many other interesting CEA reports here. Occupational licensing is next on my in box.)
The report is really well done, for explaining the economic issues in clear simple terms, but without hesitating to use a model and an equation when necessary. If you're wondering how to keep your undergraduate or MBA class (heck, your PhD class) busy this week, this report will do the trick.
There is some grumbling in economics circles about the CEA and what role it should play, between Sunday morning talk show cheerleader for the Administration's policies vs. providing dispassionate economic analysis to the Administration and country. This kind of report is the kind of CEA I cheer for.
I won't summarize the whole thing. Maury and Linda's blog post blog post does a great job of that, and you should just go read it. A few comments however.

2. Said: "The long-term interest rate is a central variable in the macroeconomy. A change in the long-term interest rate affects the value of accumulated savings, the cost of borrowing, the valuation of
investment projects, and the sustainability of fiscal deficits."
Unsaid: The surprise decline in long-term interest rates has been a boon to financing deficits. Current deficit forecasts use the current forecast of a return to higher interest rates. If this forecast is wrong once again, and real interest rates on government debt continue at rock-bottom levels, this will be a boon to "fiscal sustainability." Of course, the opposite is also true: If a trend nobody expected and everyone expects to reverse does reverse, then countries with big debts are in trouble.

3. The long term graph makes nicely a point that's been on the back of my mind lately. People typically assume that long term bonds should pay more then short term bonds, because they are riskier. But that's actually a puzzle: most bond investors hold their money for long periods of time, for which long term real bonds are less risky. It's hard, in fact, to get most term structure models to produce an upward-sloping yield curve.
It was not always so. In the 19th century, short term yields were consistently above long term yields.
The difference, of course, is inflation. In the 19th century we were on the gold standard, as noted in the graph. So long term bonds did not have inflation risk. So, if inflation continues to die, or if our central banks go on a price level target, we might expect the same pattern to hold again. Which would be great for financial stability too. Short term debt causes runs and crises. If long term debt were cheaper, the inducement to finance short would be less.
4. Uncertainty. A message you read loudly between the lines is, that we have very good theoretical understanding of the various mechanisms that can move the trend in interest rates up or down, we (meaning "economic science") have really very little idea of the quantitative force of various mechanisms. By masterfully explaining each mechanism, and then patiently reviewing the vast literature that comes up with hugely different numbers for each mechanism, the point is made clearly, though between the lines.
They might go further. For example, the section on term premiums (the long rate is the average of expected future short rates plus a term premium) cites the latest studies and plots a line, but no standard error or other uncertainty band around that line. As this is an area I've written papers on, I know where the bodies are buried. Term premium estimates come down to forecasting regressions of future bond returns on current variables. Such regressions have huge bands of uncertainty. All forecasts and decompositions should have error bars. The only problem is artistic, as honest error bars would dwarf the forecasts. Well, knowing what you don't know is real knowledge.
5. Forecasts. On p. 26, after this implicit devastating critique of the state of knowledge, "To illustrate our analyses, we illustrate different approaches to forecasting the long-term nominal interest rate, as is typically done twice a year in the CEA/OMB/Treasury Budget forecast and midsession review." A process for coming up with a number follows. Clearly, the message of the previous 25 pages is that conditioning decisions on a forecast, cranked out to two decimal places, is a bad idea. Economic policy should embrace uncertainty!
This is really a big deal. Much of the illusion of technocratic competence driving our regulatory state is reflected in absurdly accurate forecasts. The joke goes, we know economists have a sense of humor, because economists use decimal points. I'd love to see a Federal Forecast Accuracy Act: All forecasts made by every administrative agency shall include measures of forecast uncertainty. The CBO will evaluate all forecasts after the fact, and agencies shall be penalized when reality exceeds the stated uncertainty bounds more than half of the time.
6. The CEA ain't buying "secular stagnation," in its perpetual "lack of demand" interpretation. (As a fact, it's undeniable. The question is the diagnosis and treatment.) See p. 38.
7. In a report whose summary sections are Fiscal, Monetary, and Foreign-Exchange Policies, Inflation Risk and the Term Premium, Private-sector Deleveraging, Lower Global Long-run Output and Productivity Growth, Shifting Demographics, The Global “Saving Glut”, Safe Asset Shortage, Secular Stagnation?, and Tail Risks and Fundamental Uncertainty, it is perhaps a bit petulant to complain of left-out factors but I will mention one.
The "supply side" part of the analysis is limited to productivity growth. Higher productivity growth leads to higher real interest rates in equilibrium, and (these days) vice versa. But it takes time and transition dynamics to accumulate capital.
One hypothesis that I learned from Larry Summers is that today's production function needs a lot less physical capital to produce the same productivity. A 1930s steel mill is a lot of accumulated savings. Facebook has nothing but a basketball court sized building full of 20-somethings coding while wearing headphones, and a really cool food court. The company is worth billions but it took comparatively little accumulated savings to start it up. If technology moves so that human, rather than physical capital is the heart of the K in F(K,L), productivity growth may determine interest rates in the long run, but there are lower interest rates on the transition path. Larry:
Ponder that the leading technological companies of this age—I think, for example, of Apple and Google— find themselves swimming in cash and facing the challenge of what to do with a very large cash hoard. Ponder the fact that WhatsApp has a greater market value than Sony, with next to no capital investment required to achieve it. Ponder the fact that it used to require tens of millions of dollars to start a significant new venture, and significant new ventures today are seeded with hundreds of thousands of dollars. All of this means reduced demand for investment, with consequences for equilibrium levels of interest rates.(This is an update, thanks to email correspondent who found the quote.)
Update: Steve Williamson reminds us all that there is no "the" interest rate, and that the rate of return on capital is both stable and much higher than government bond yields. There is a risk premium, and it's big, and it varies over time. Practically all macro and growth theory forgets this fact. Since I've spent most of my career emphasizing the size and volatility of the risk premium, I should remember this reminder in every blog post. Thanks for pointing it out Steve!
Langganan:
Postingan (Atom)